Hi, I'm Jagvir Waving Hand Light Skin Tone

Data Analyst & Accountant

Resume

About Me πŸ‘¨β€πŸ’»

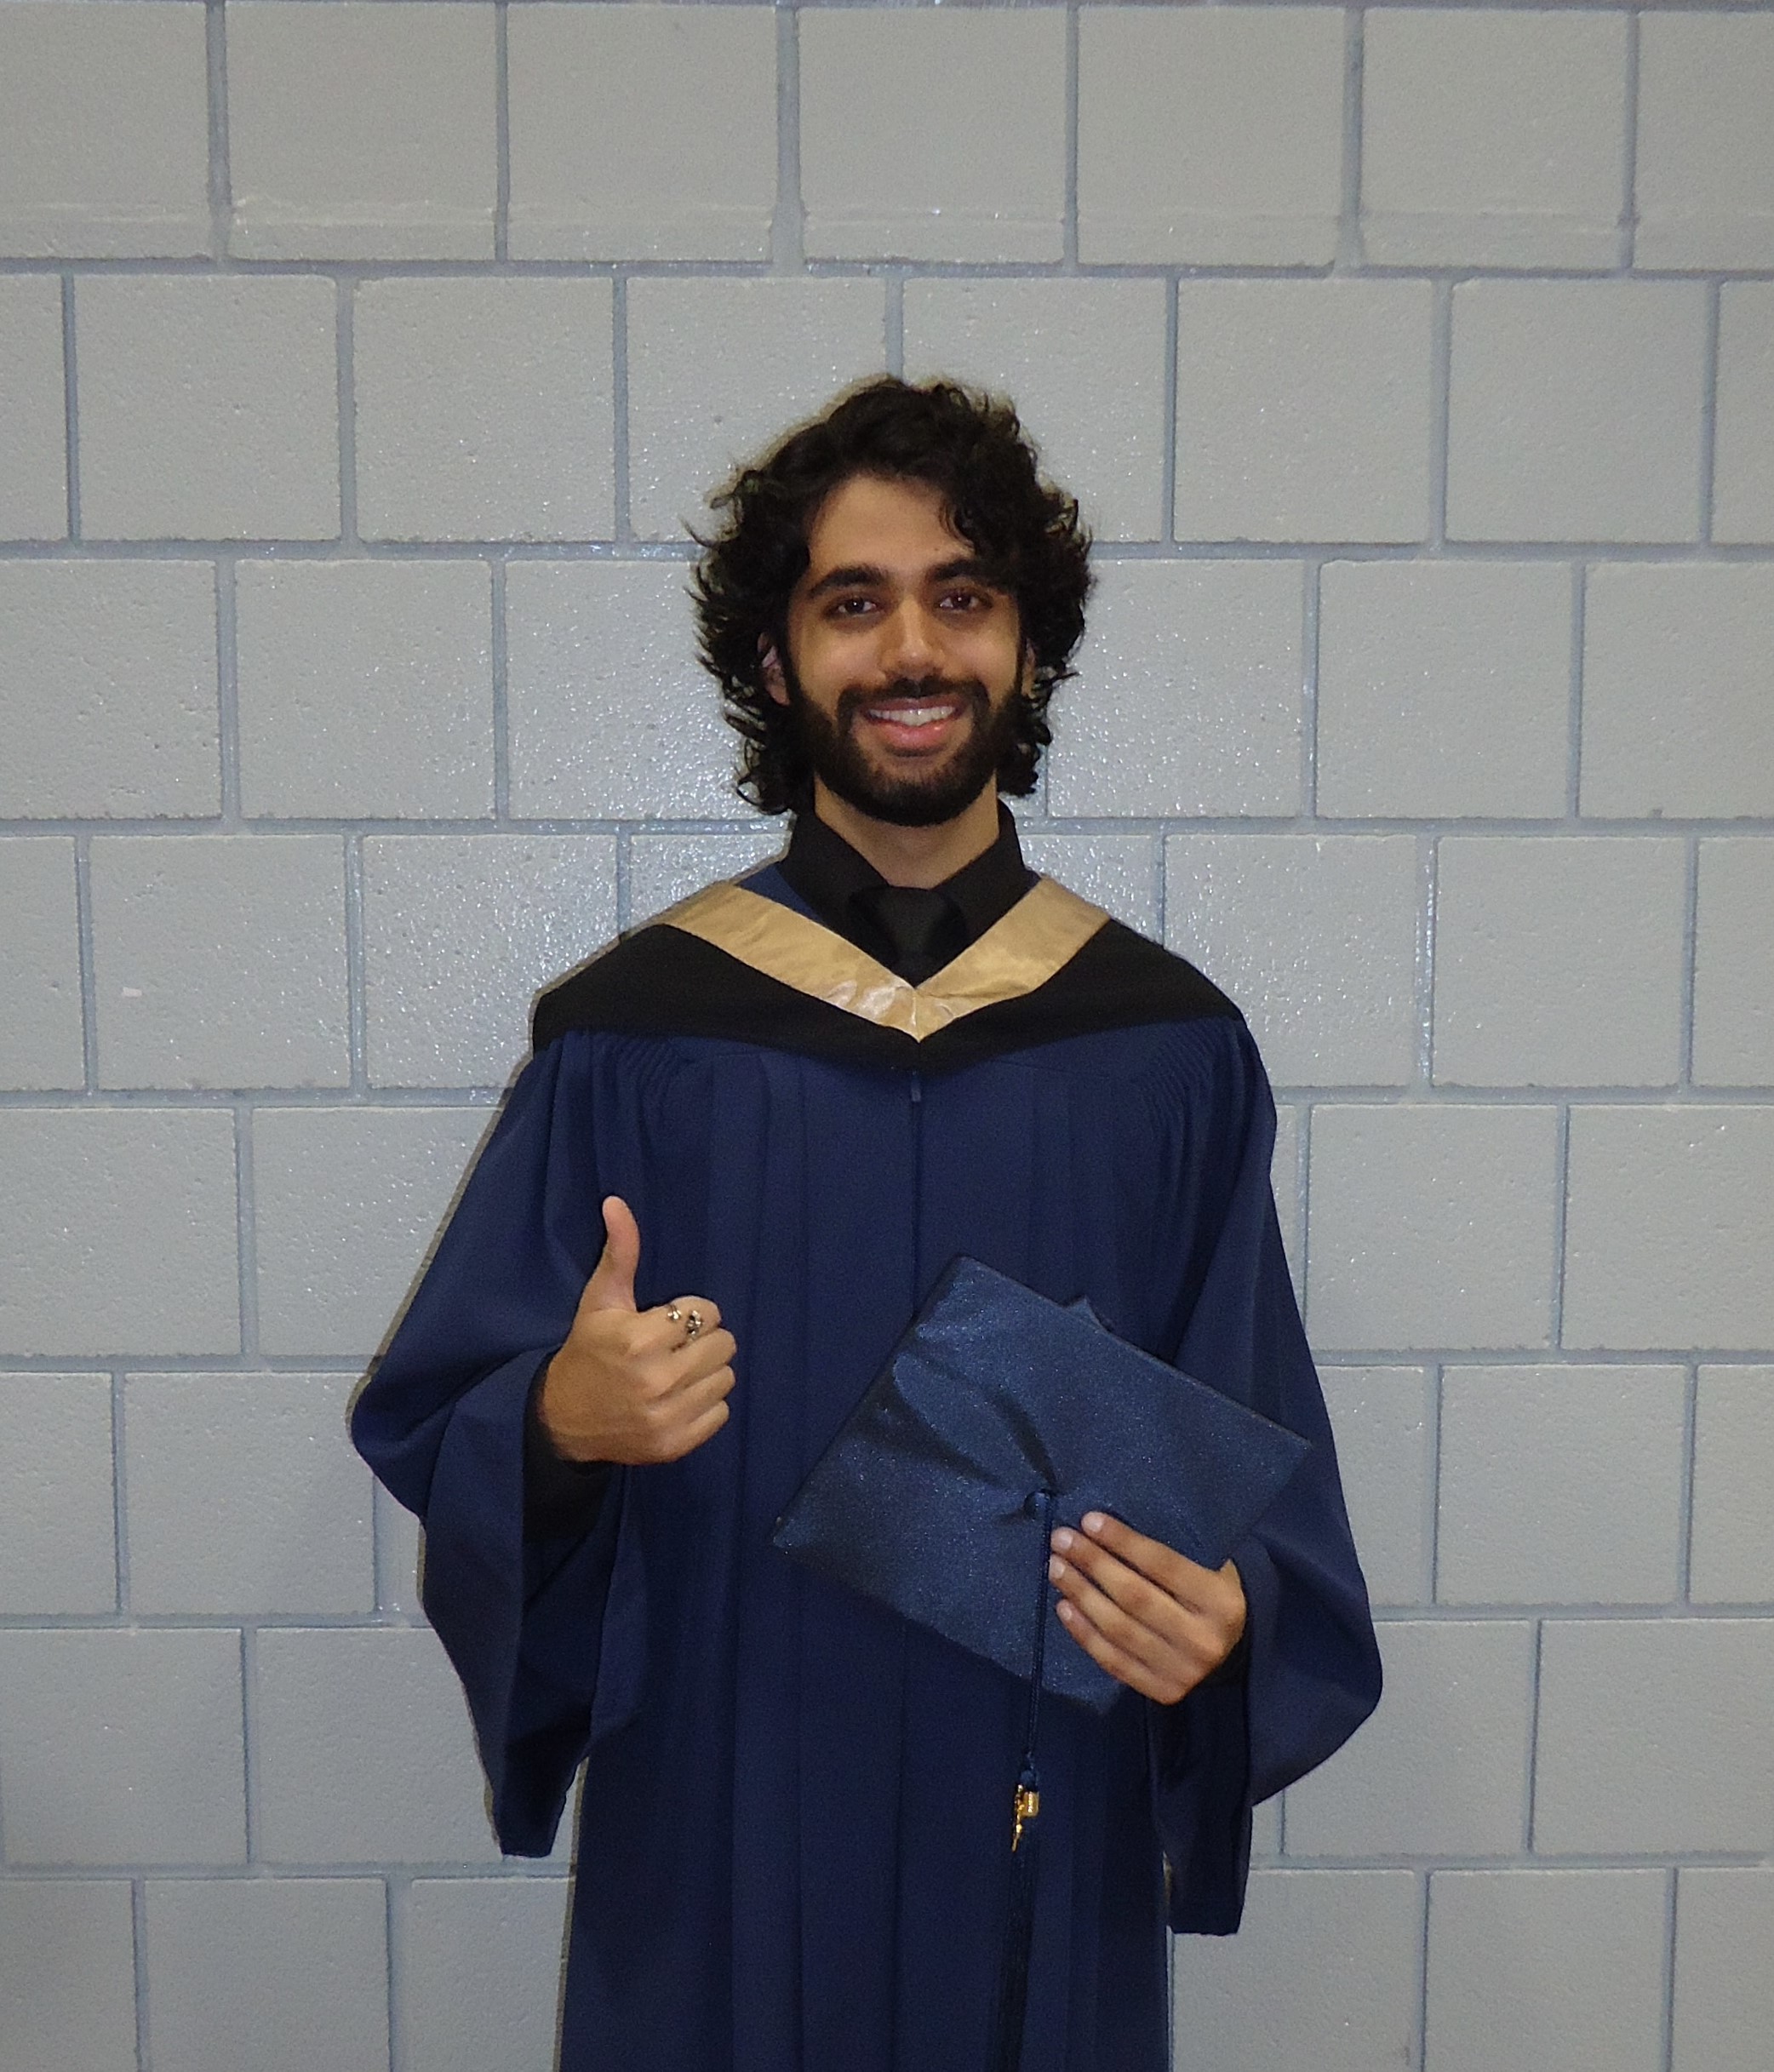
Hello! I'm Jagvir Dhesi, a graduate of Mount Royal University, where I earned a degree in Accounting and a minor in Finance. My time at university exposed me to various subjects, including information systems and statistics, which sparked my interest in the captivating field of data analytics.

After completing my degree and gaining valuable work experience, I decided to further expand my knowledge in the data field. I enrolled in an intensive Data Science program, where I delved deeper into the concepts I had previously learned in university. This program provided me with comprehensive insights into data management techniques like ETL (Extract, Transform, Load) and EDA (Exploratory Data Analysis). While also learning Python, SQL, Tableau, etc.

Through this journey, I've cultivated a passion for leveraging data to gain valuable insights and make informed decisions. I'm excited to continue exploring the fascinating world of data analytics and contributing my skills to meaningful projects.

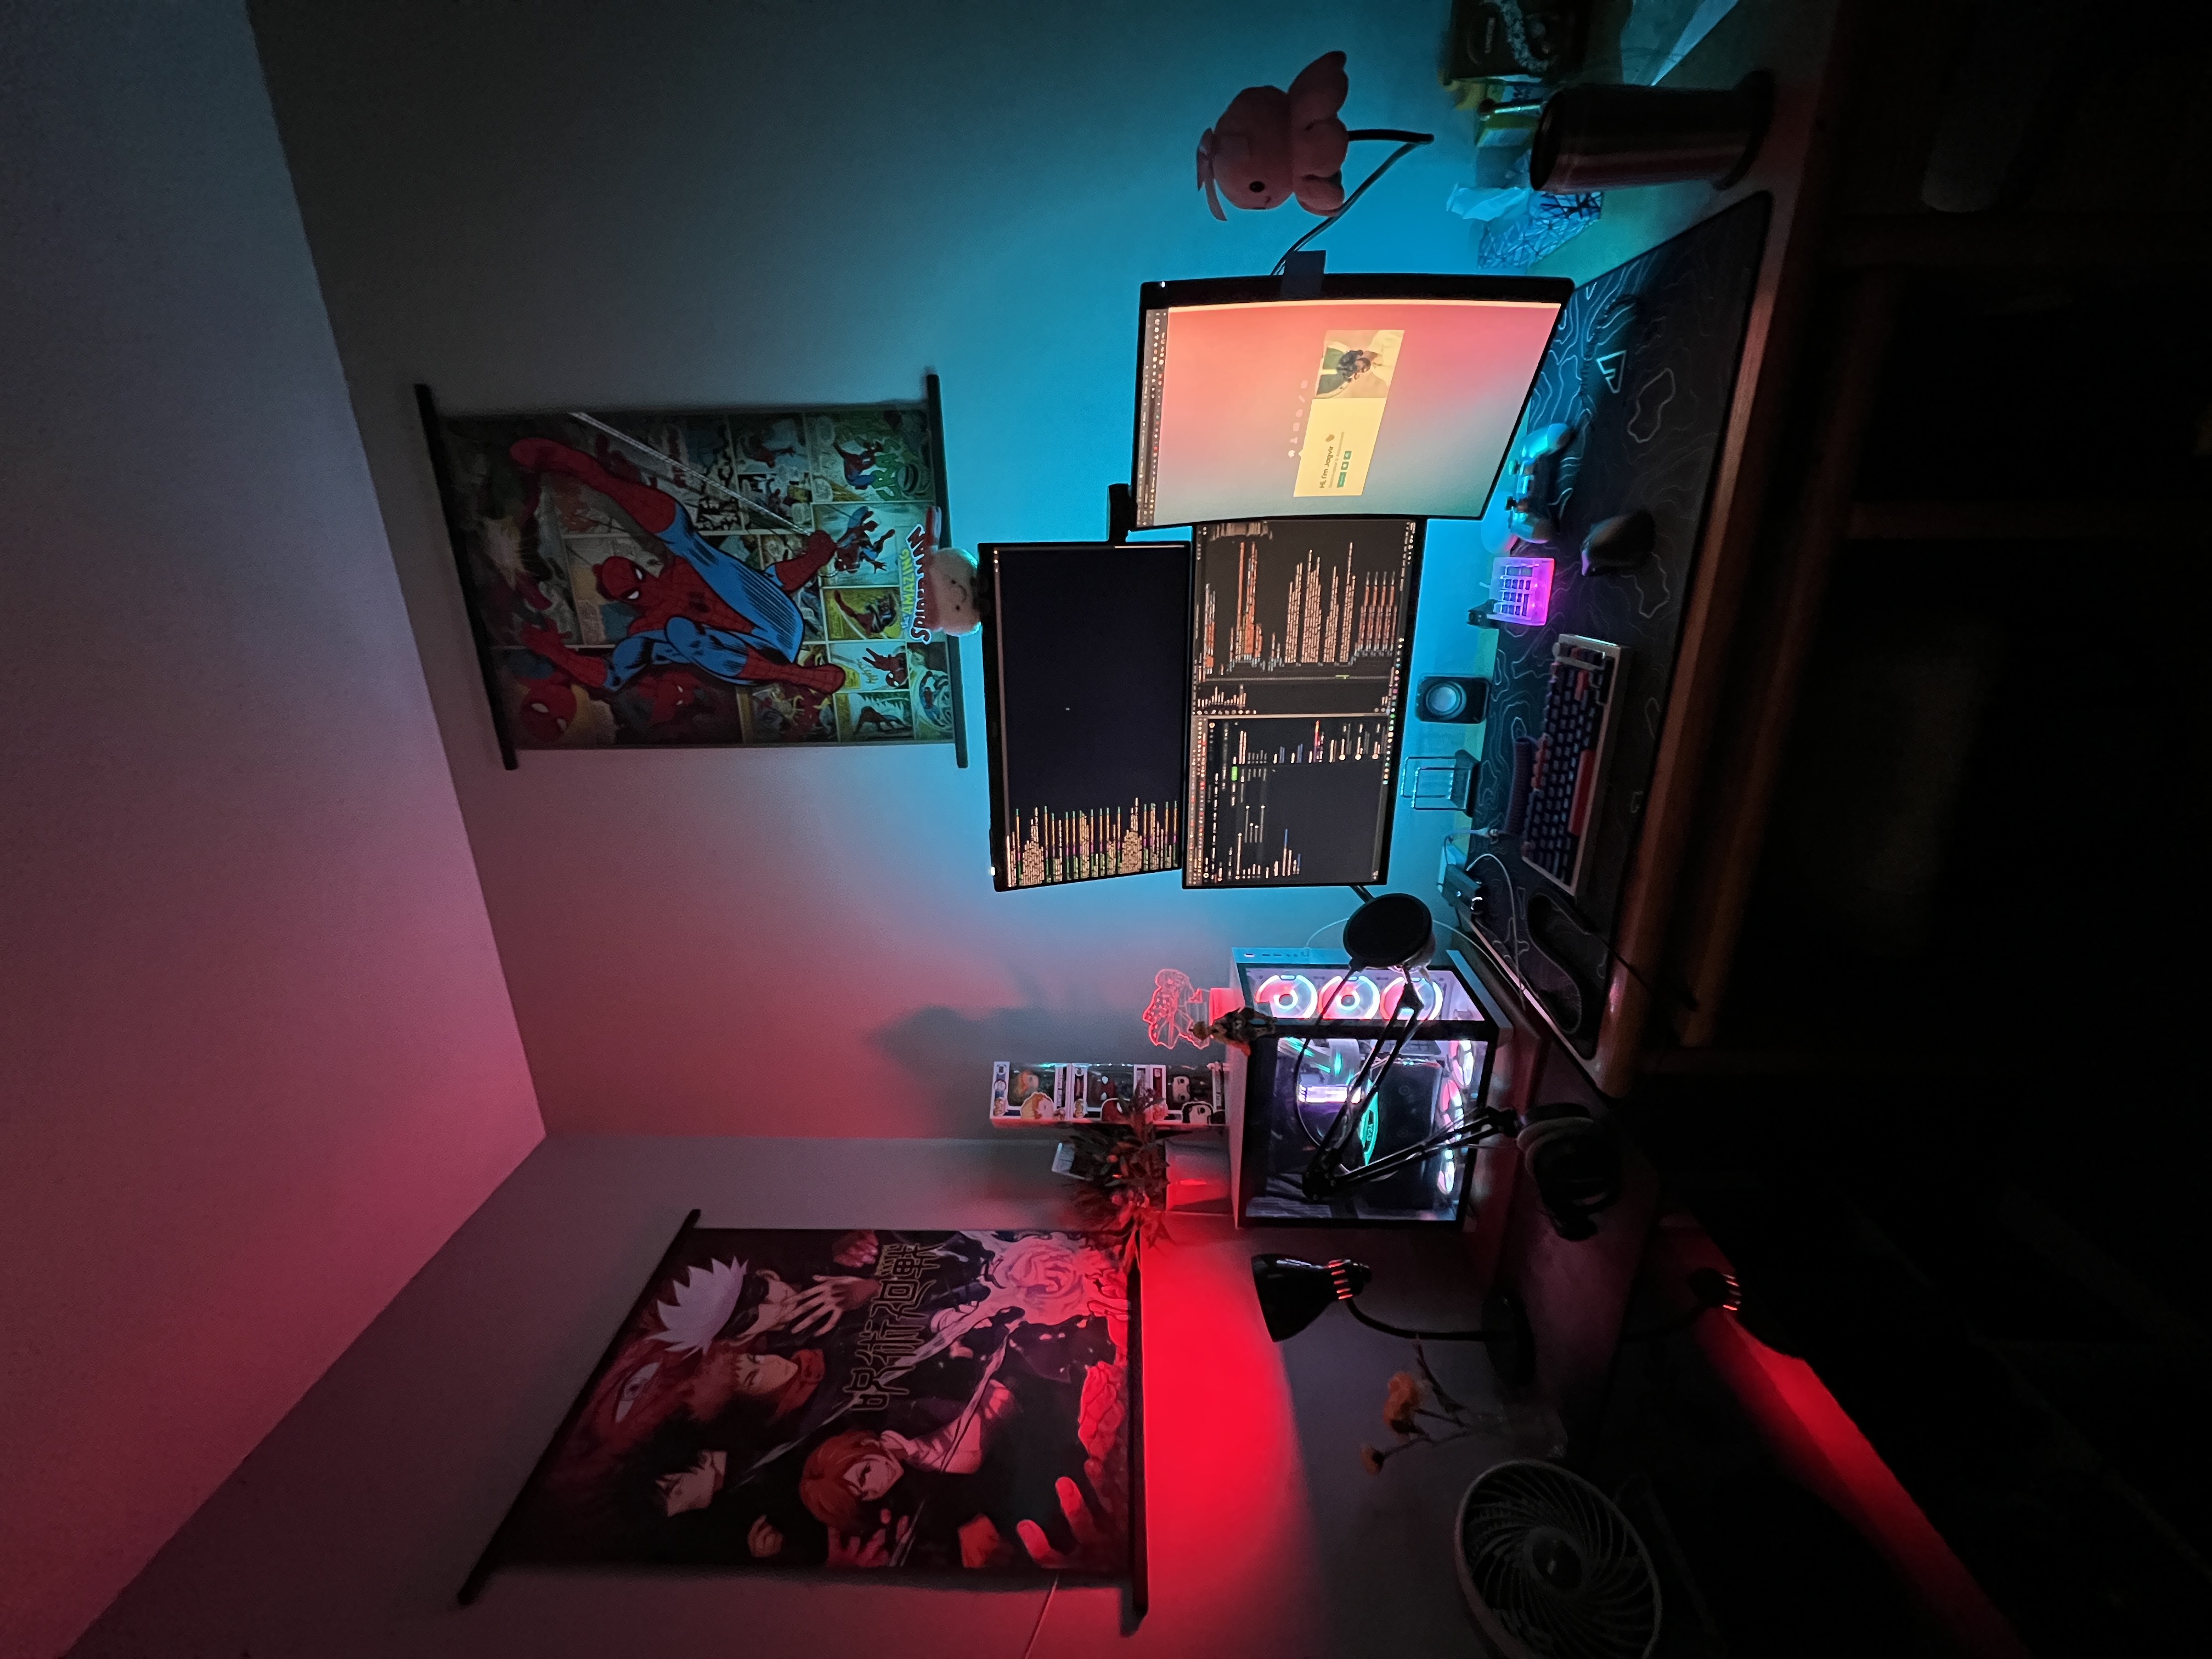
In my free time, you can often find me immersed in anime & movies, exploring the world of video games (currently playing Baldur's Gate 3, Silent Hill 2, and Spider-Man 2) with Skyrim being my all time fav! I'm also passionate about playing the guitar, which I'm still learning πŸ€“ and photography.

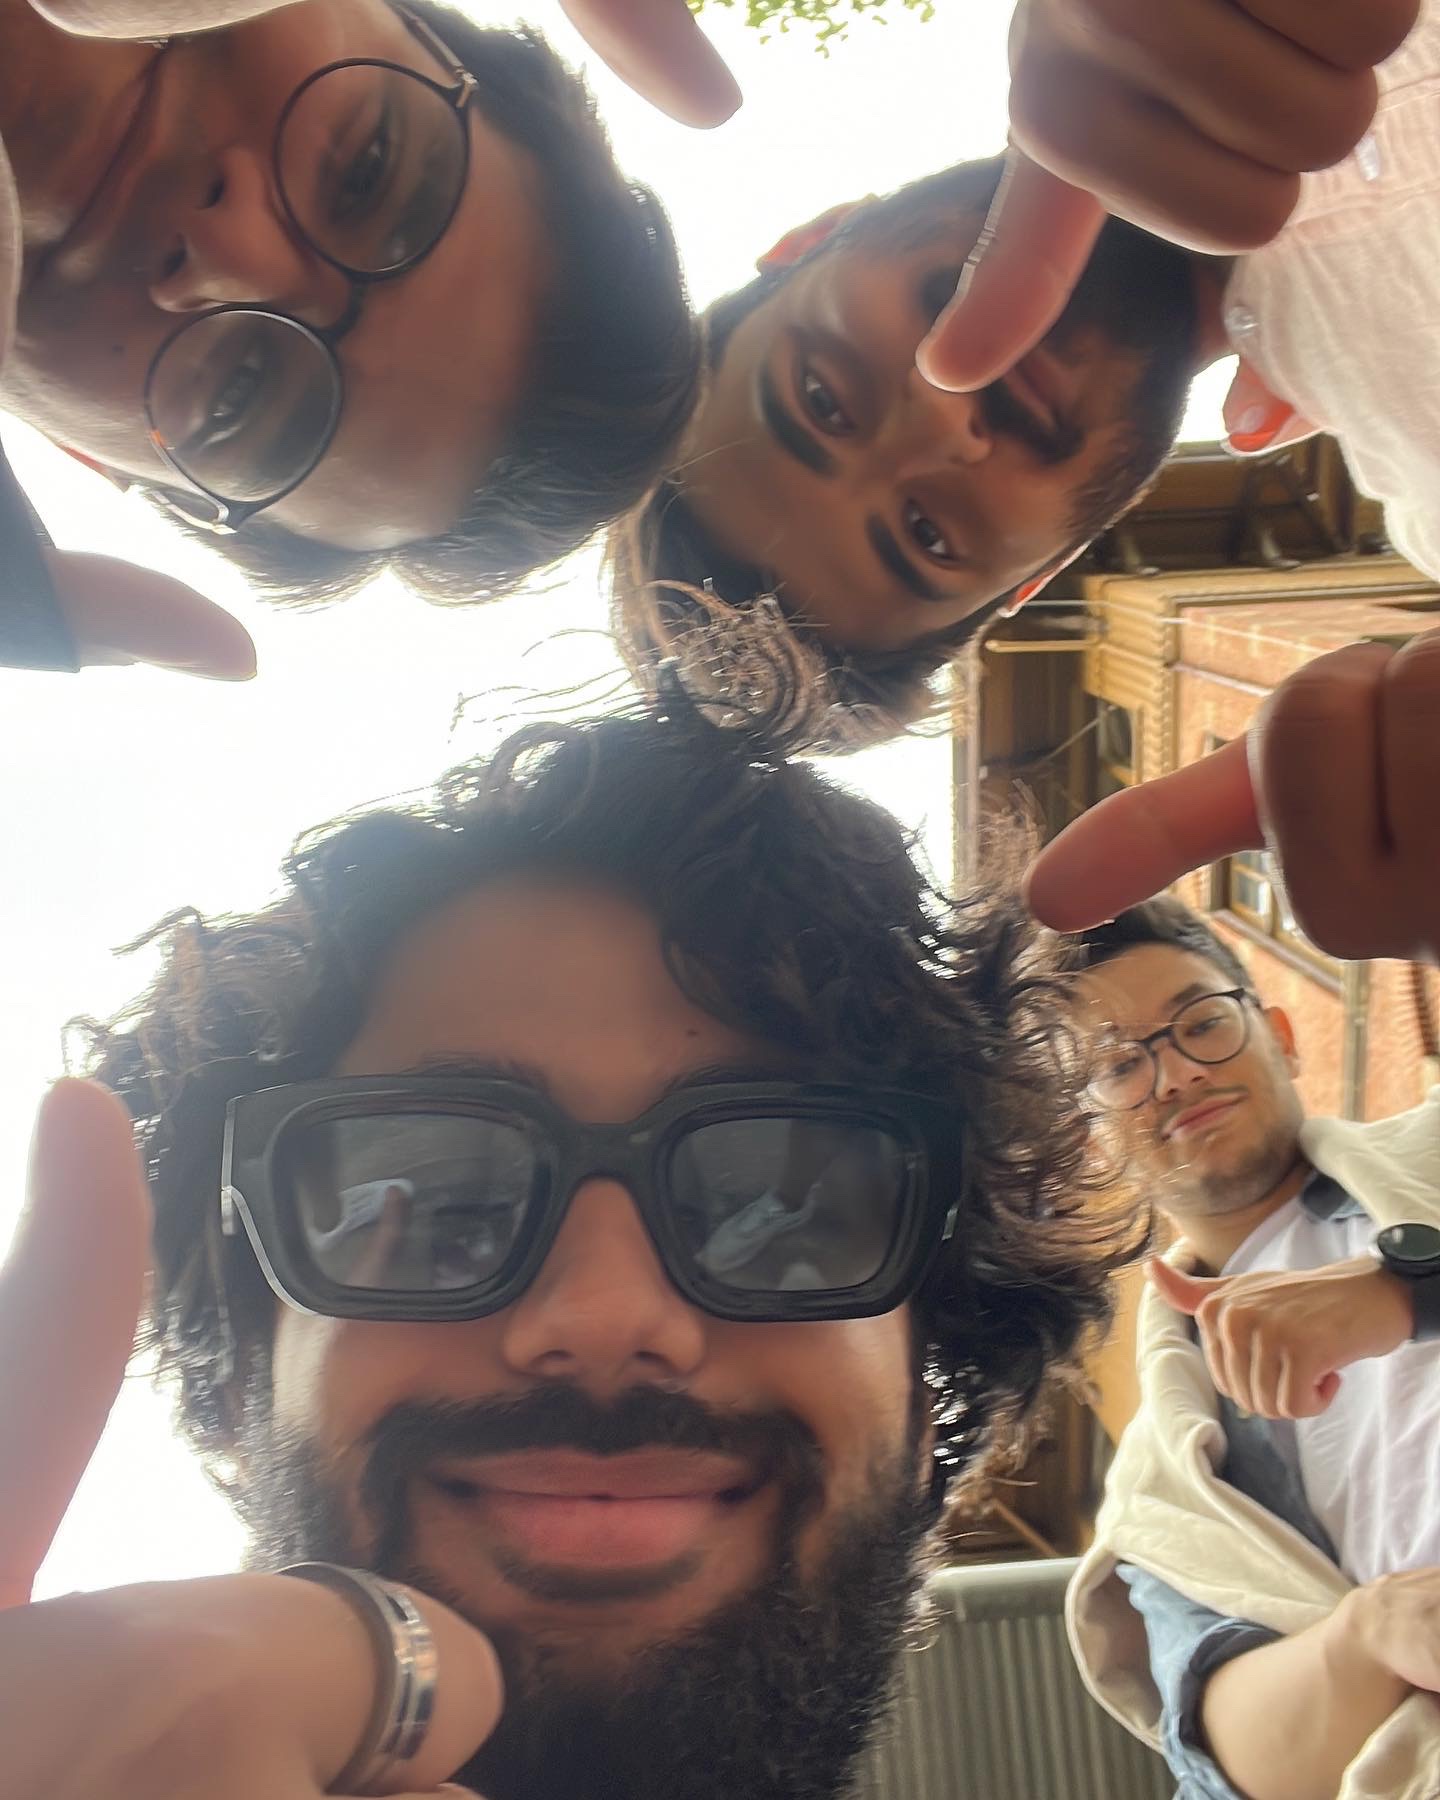
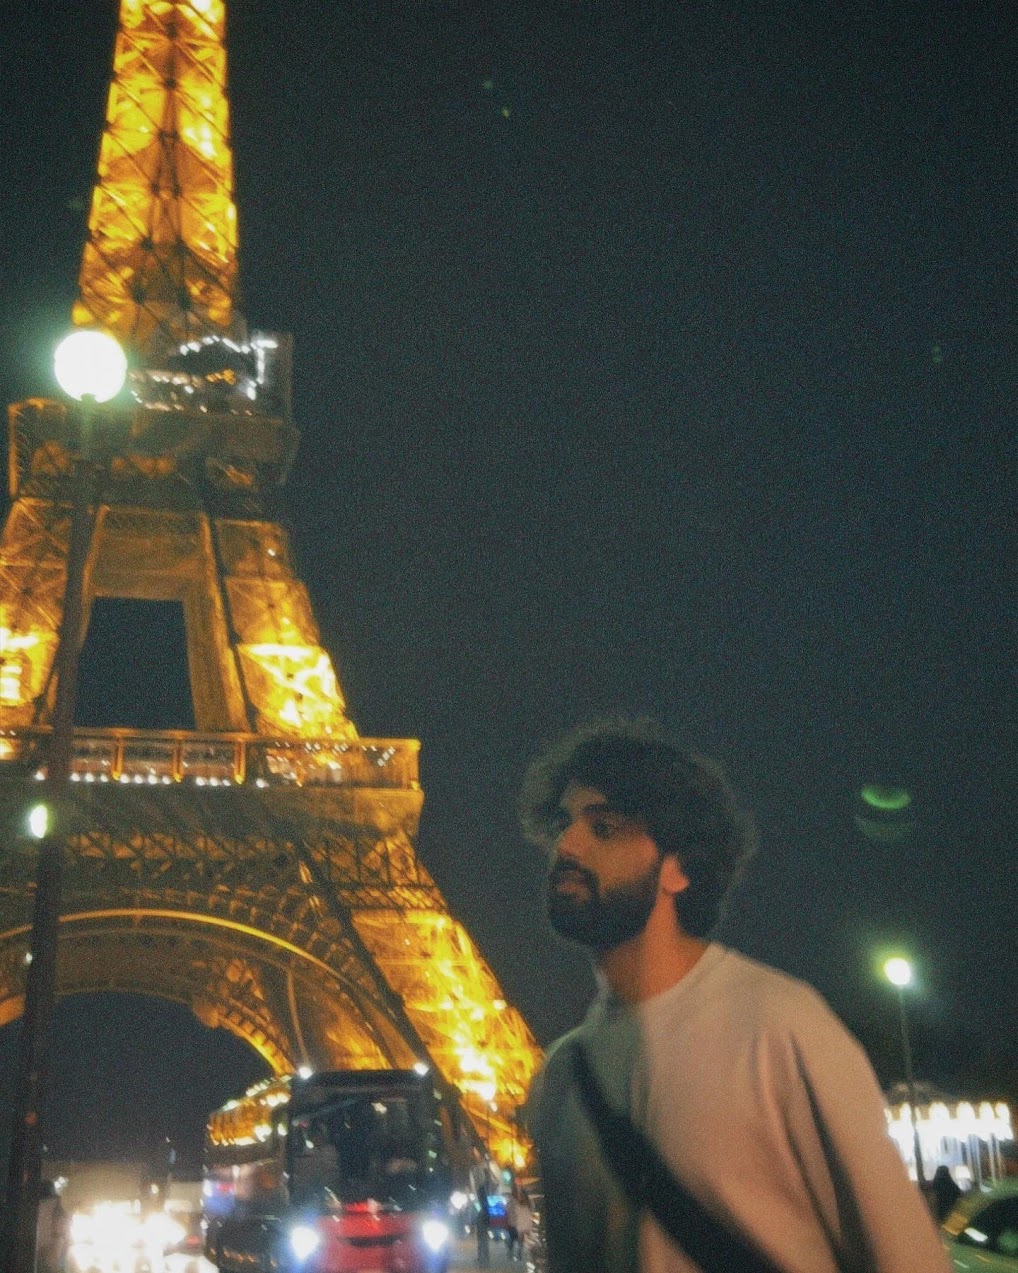
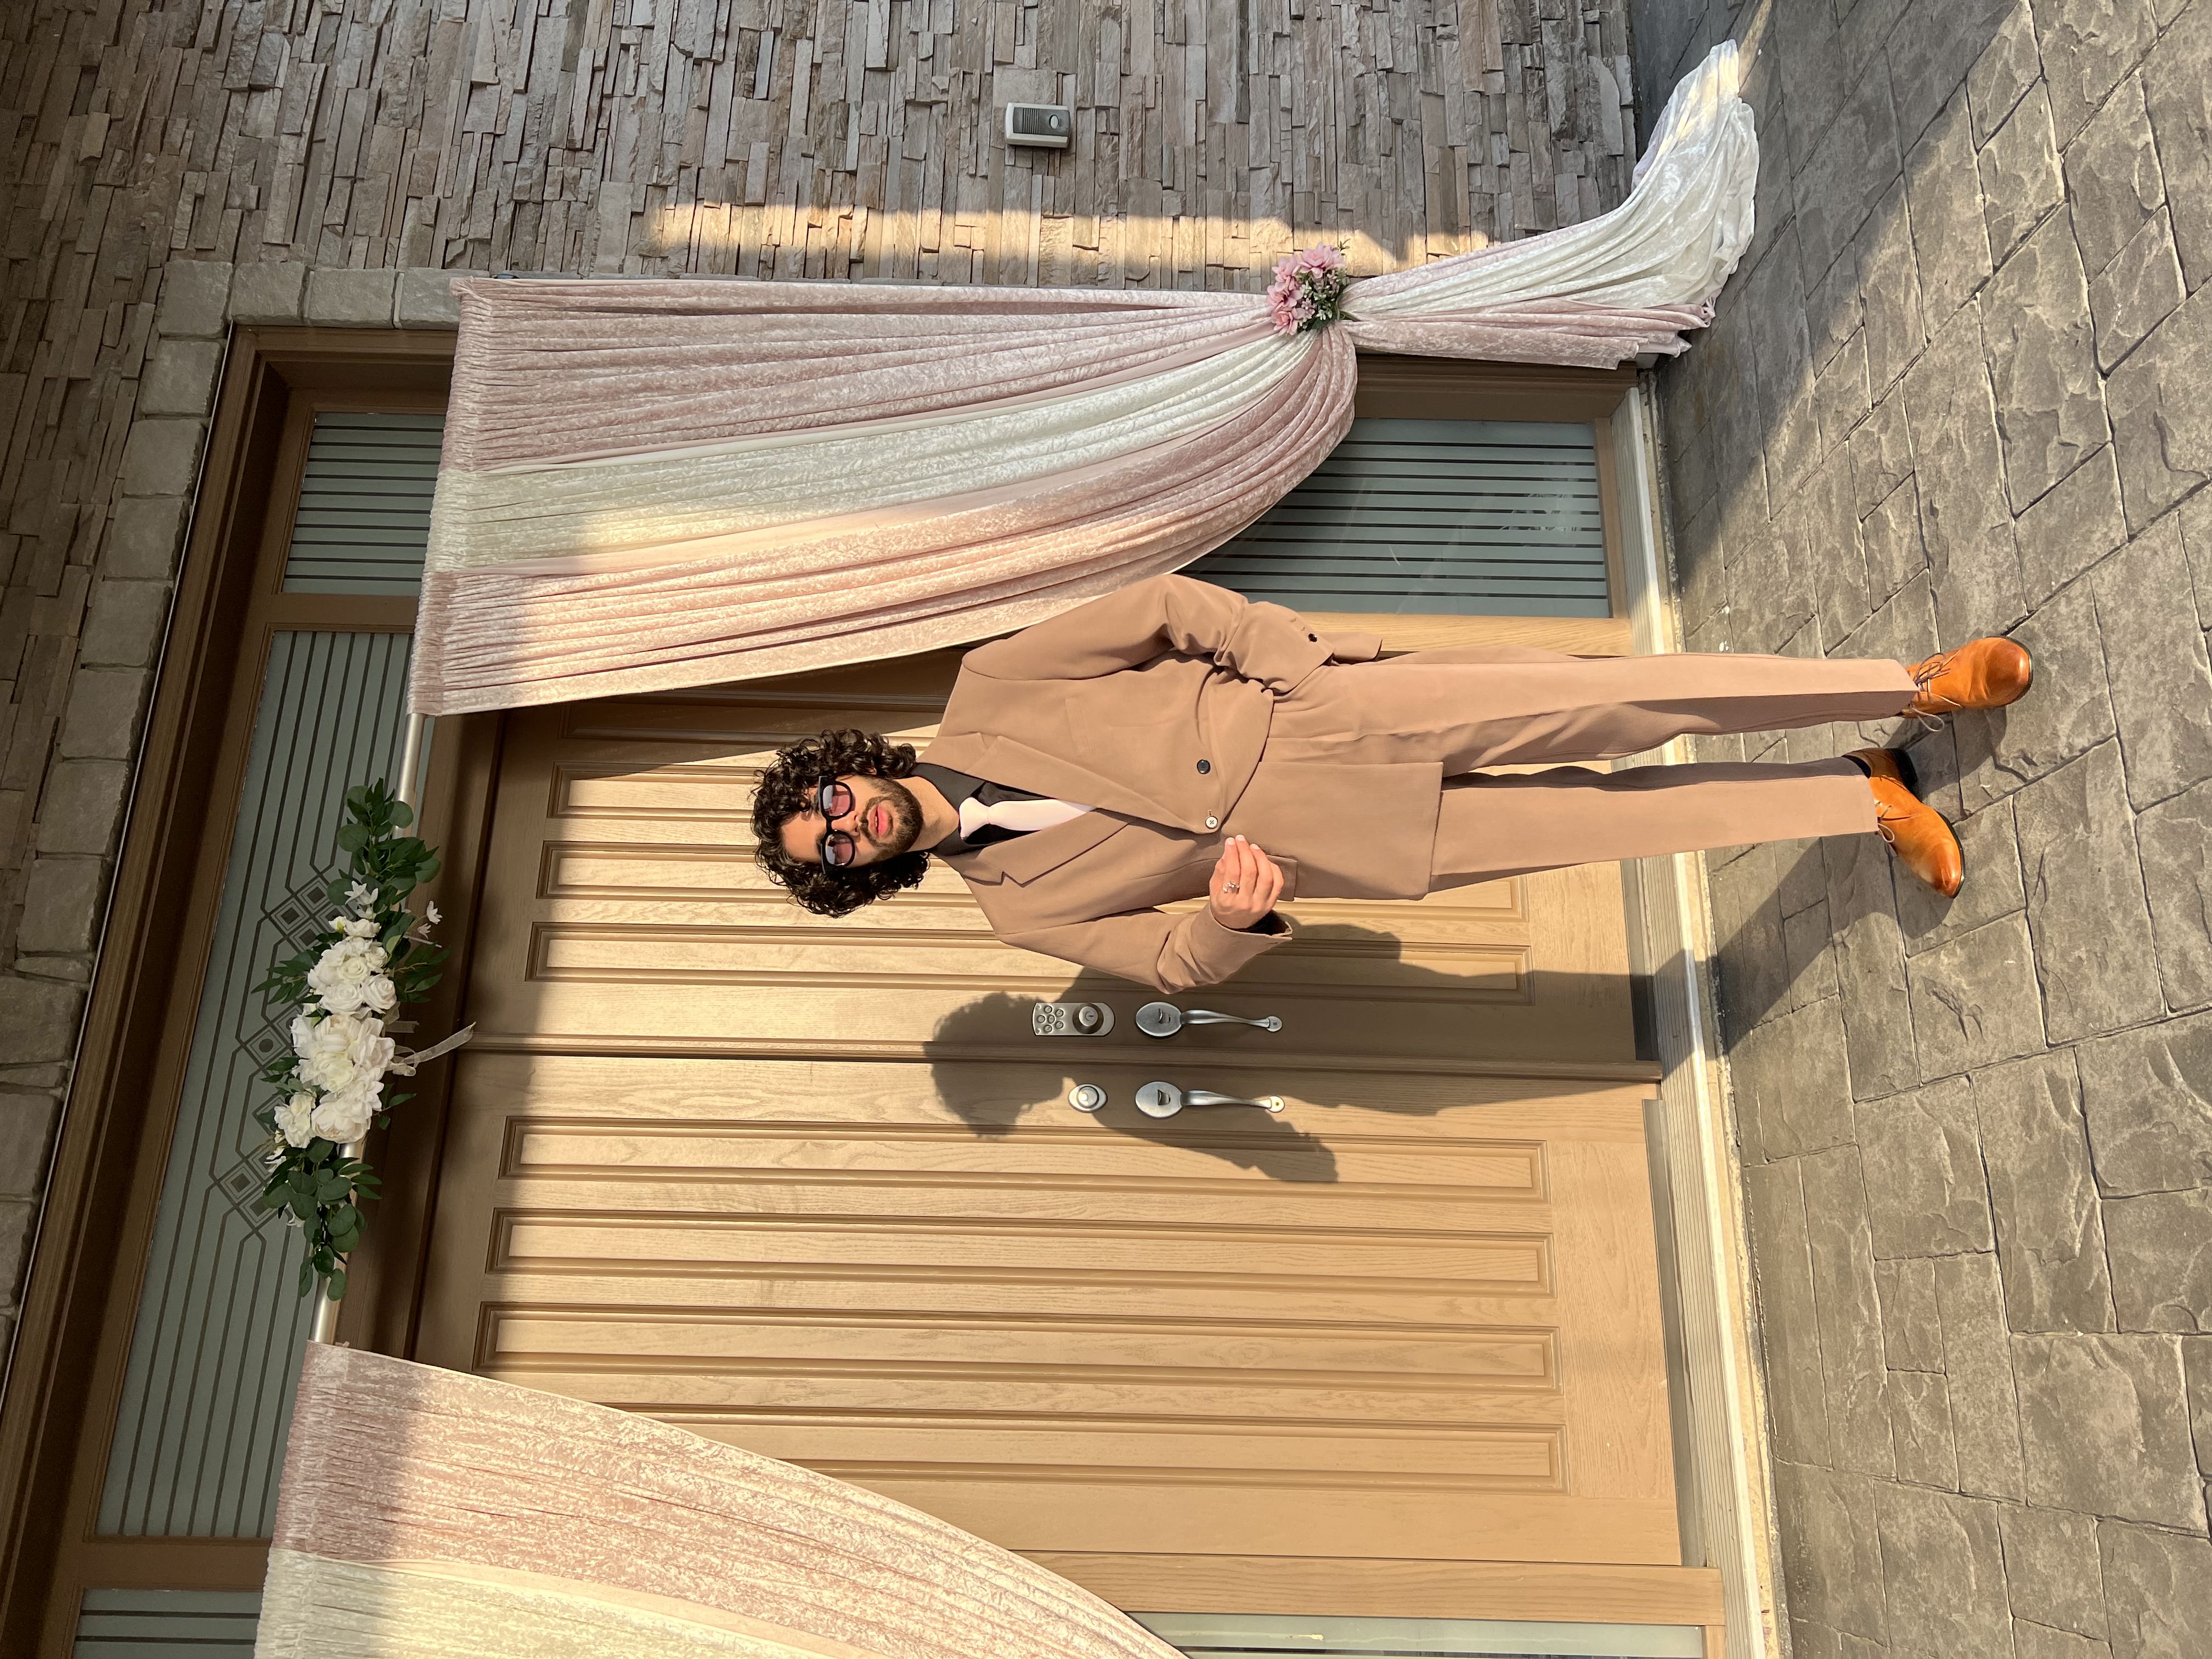
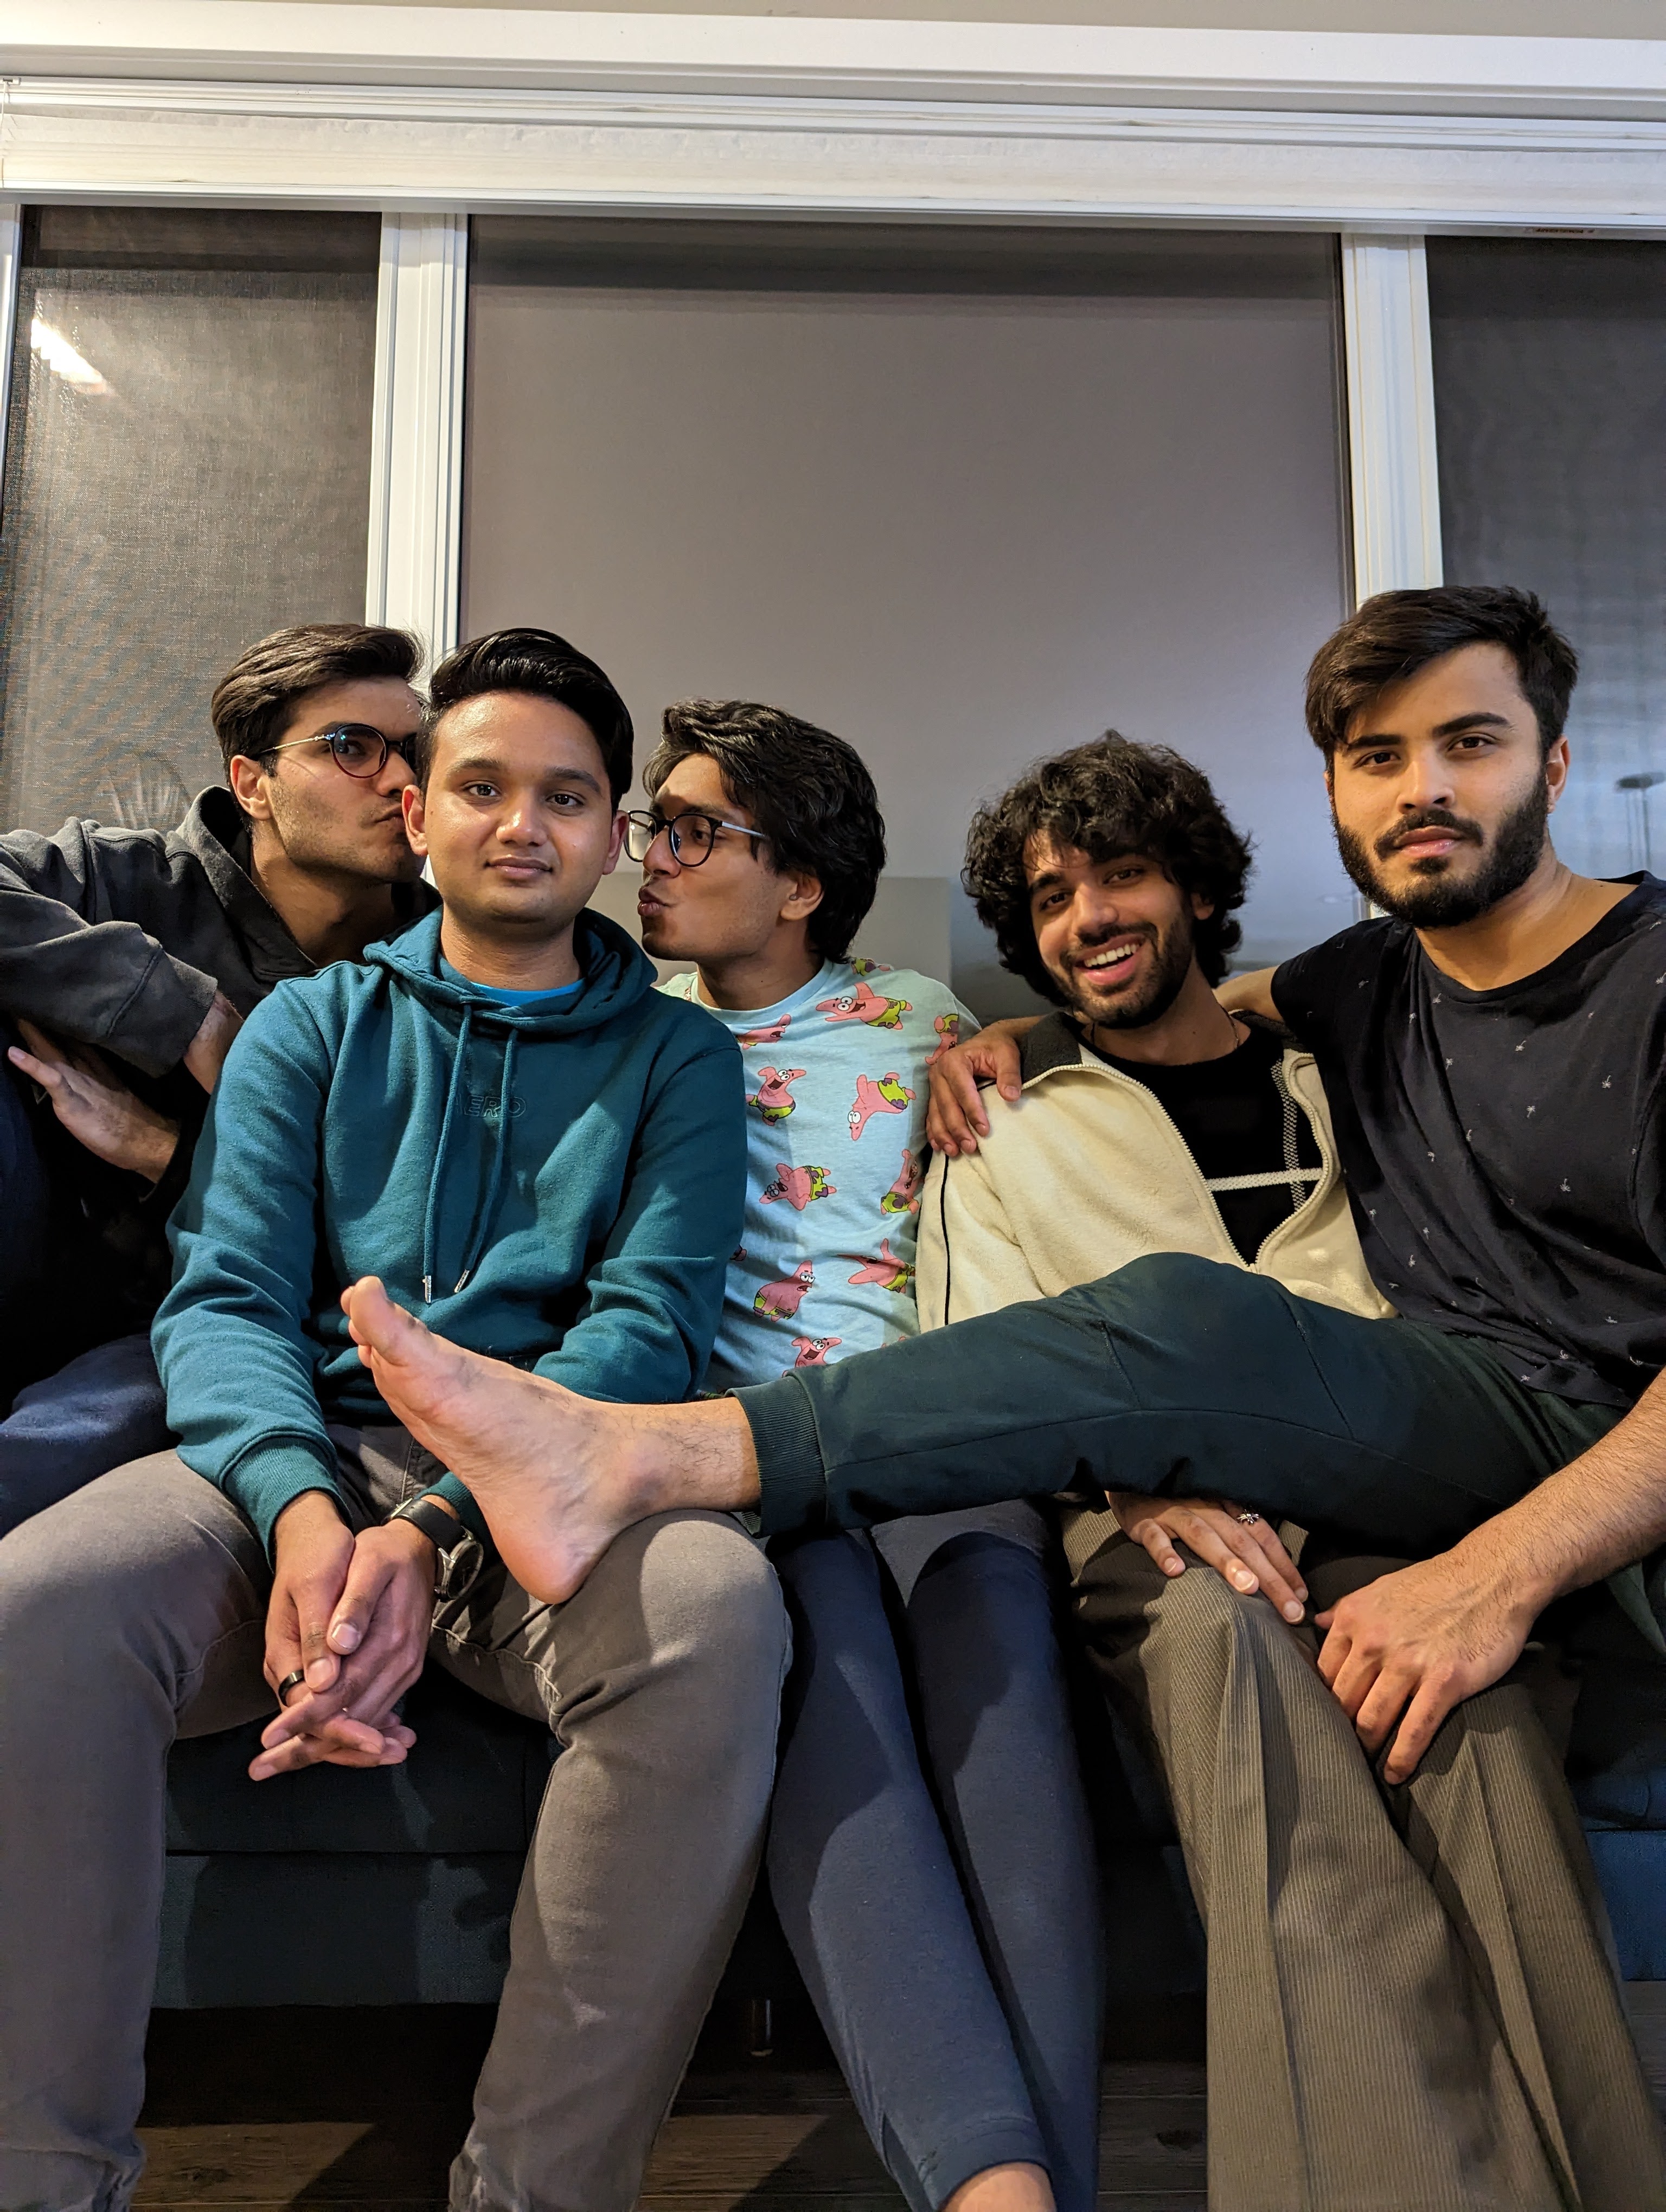
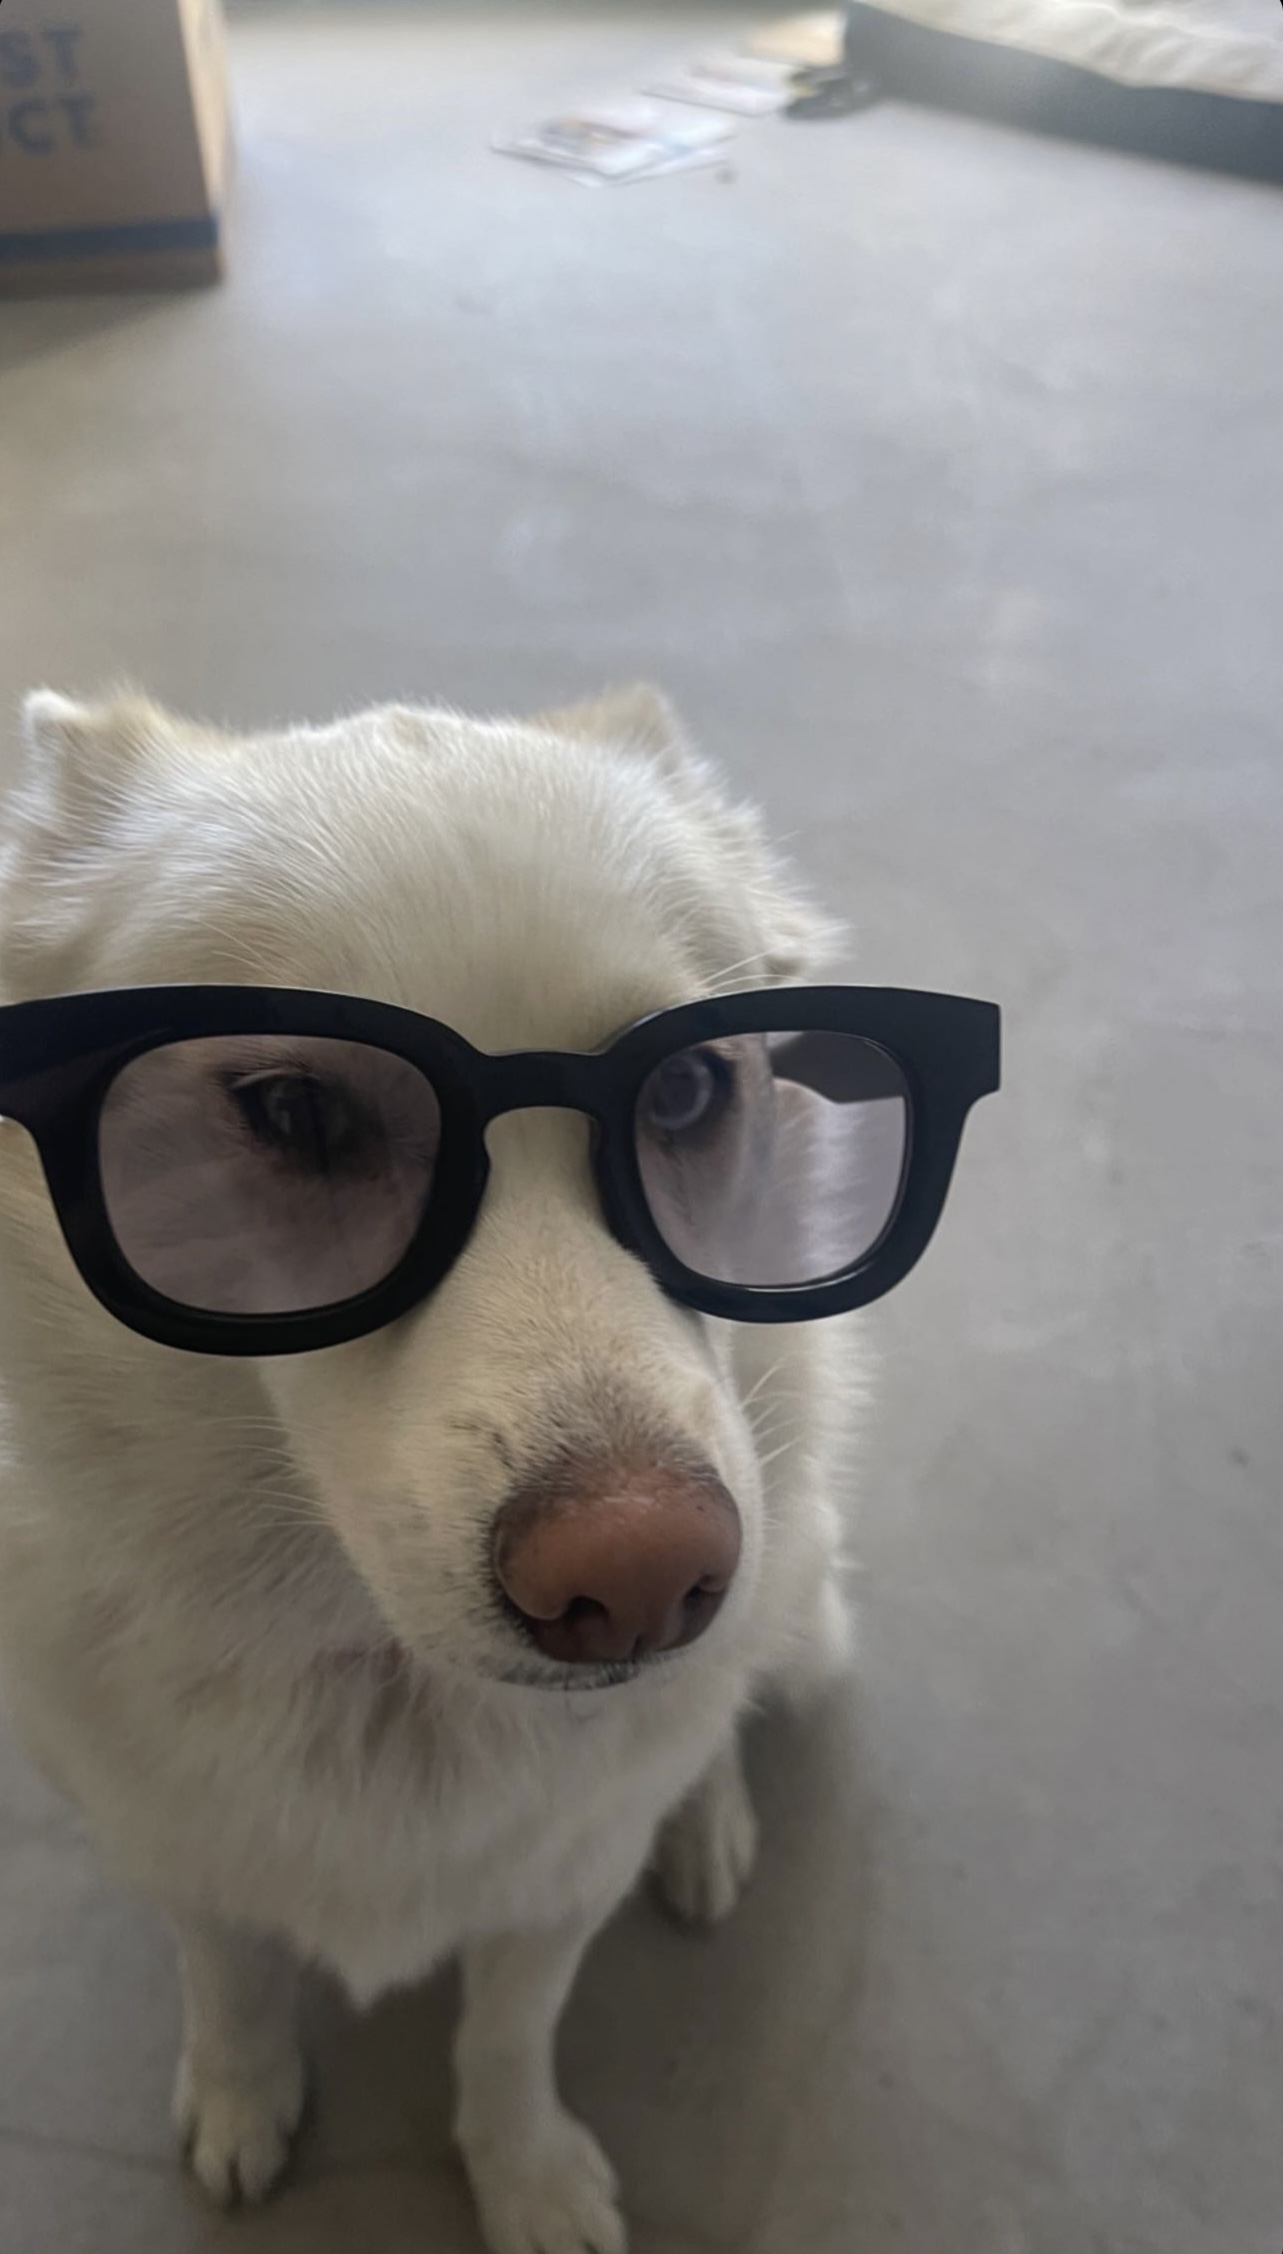
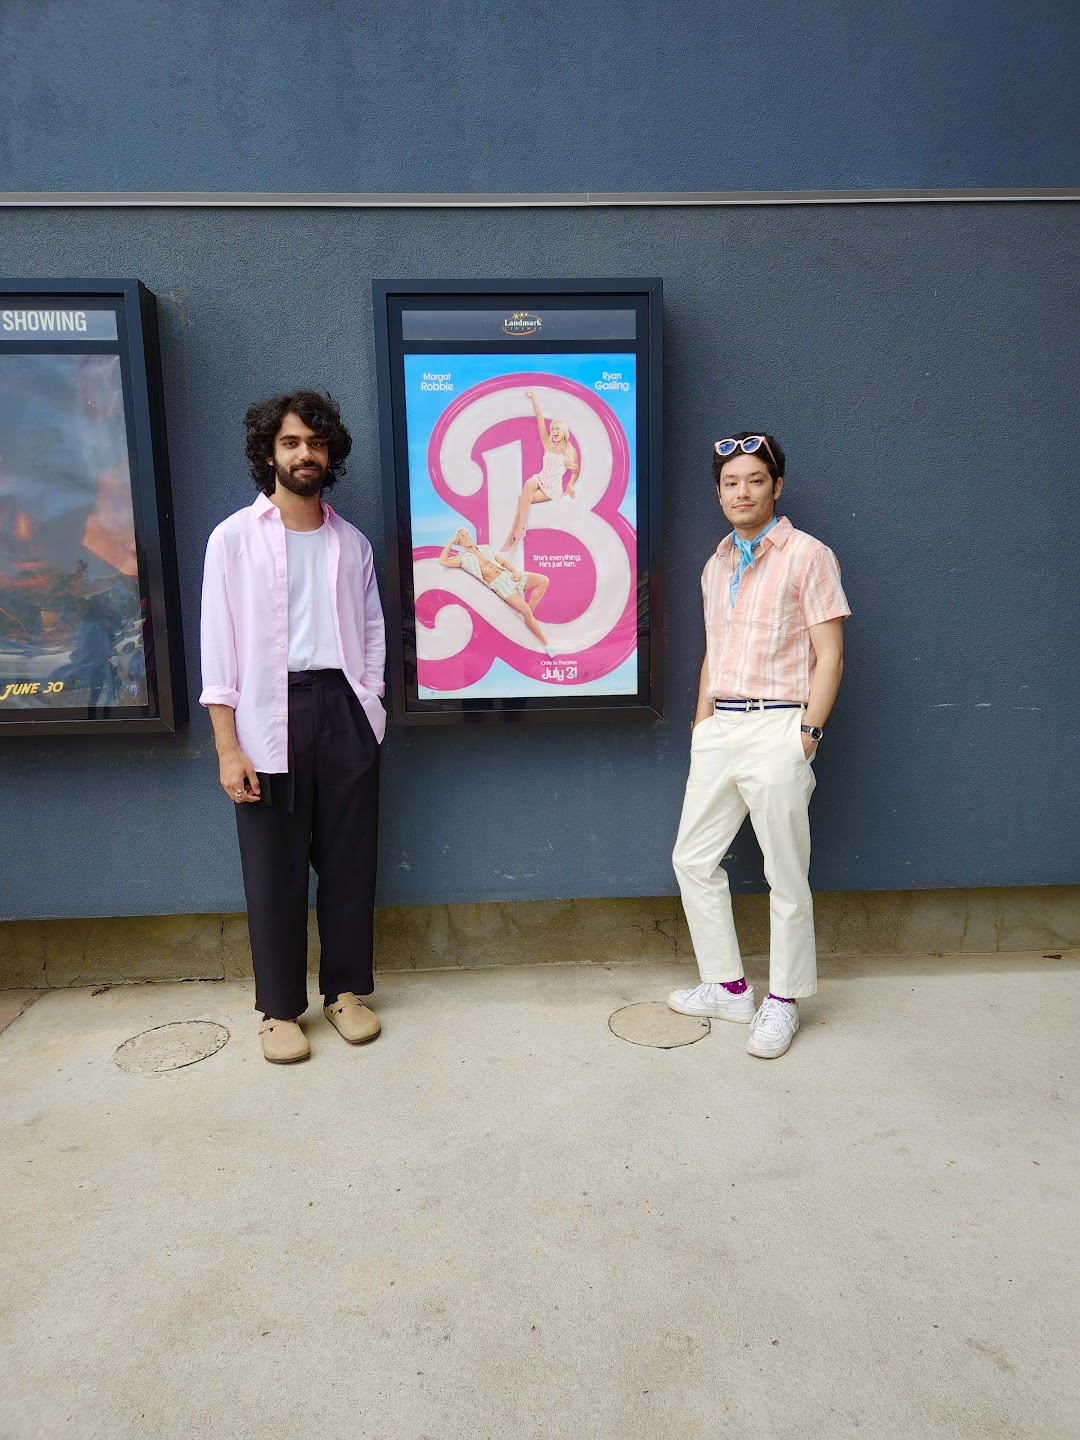
Here are some random pictures:

Blog πŸ“«

Welcome to my blog! Here, I will share what I'm up to and some of my interests in regards to travel, entertainment, gaming, etc. Airplane Camera with Flash

Blog Image

Trip to Italy

June 2023

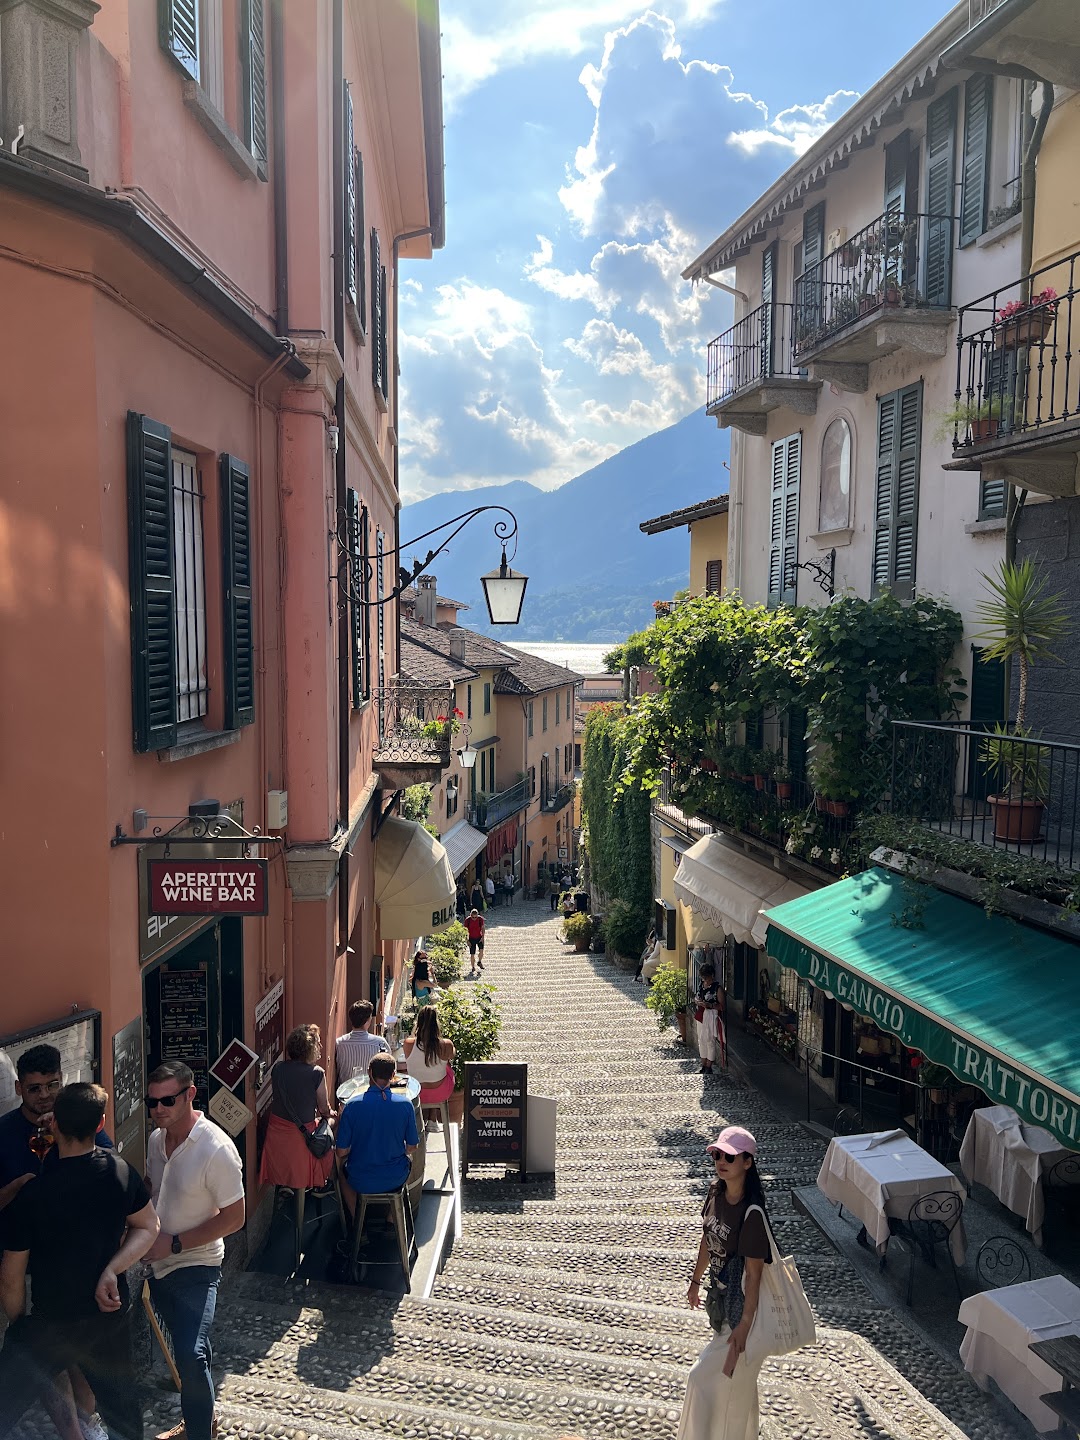
Summer trip to Lake Como, Rome, Florence and Verona 🍝
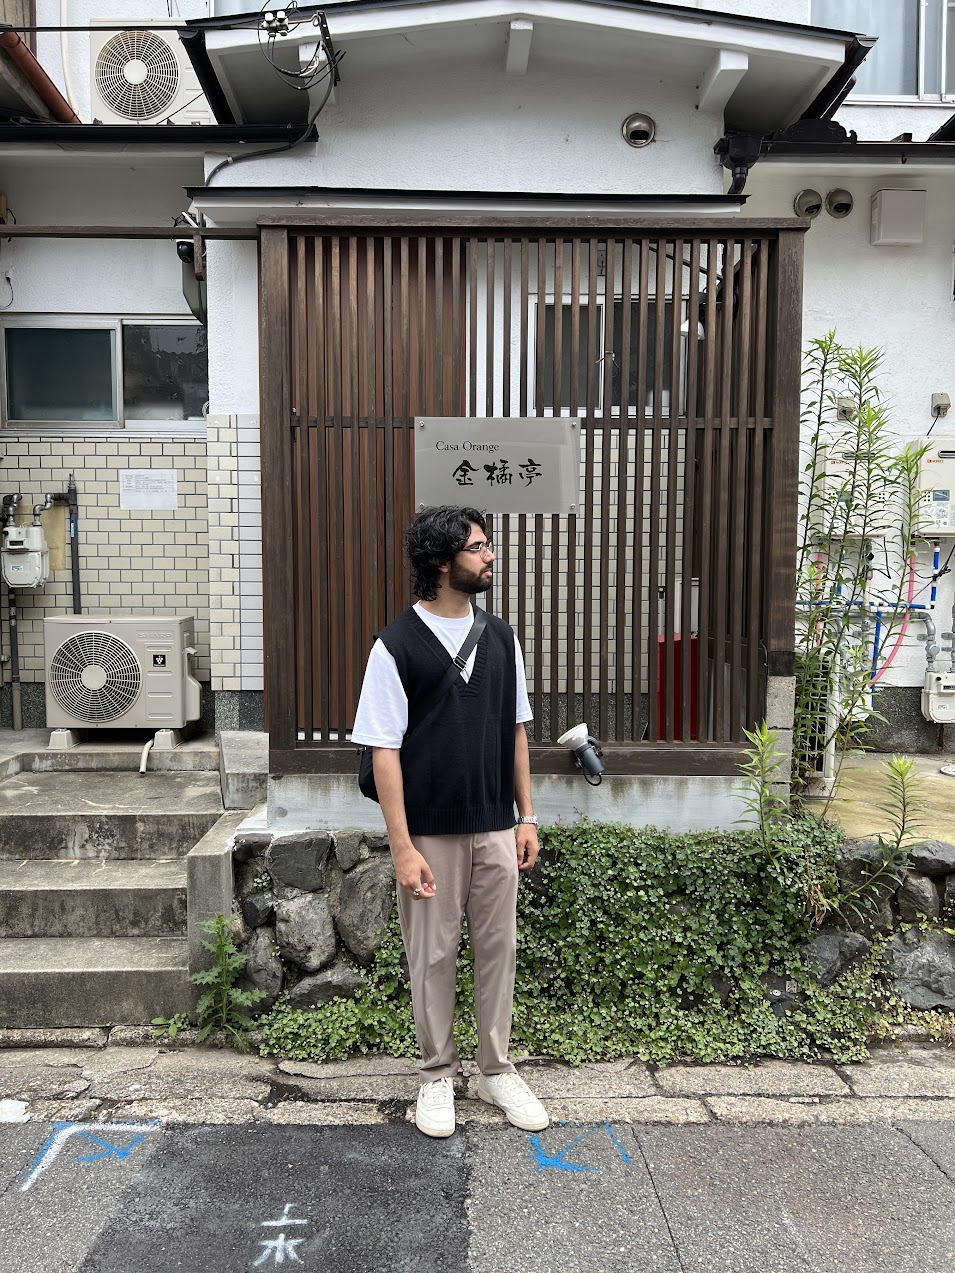
Blog Image

Trip to Japan

June 2023

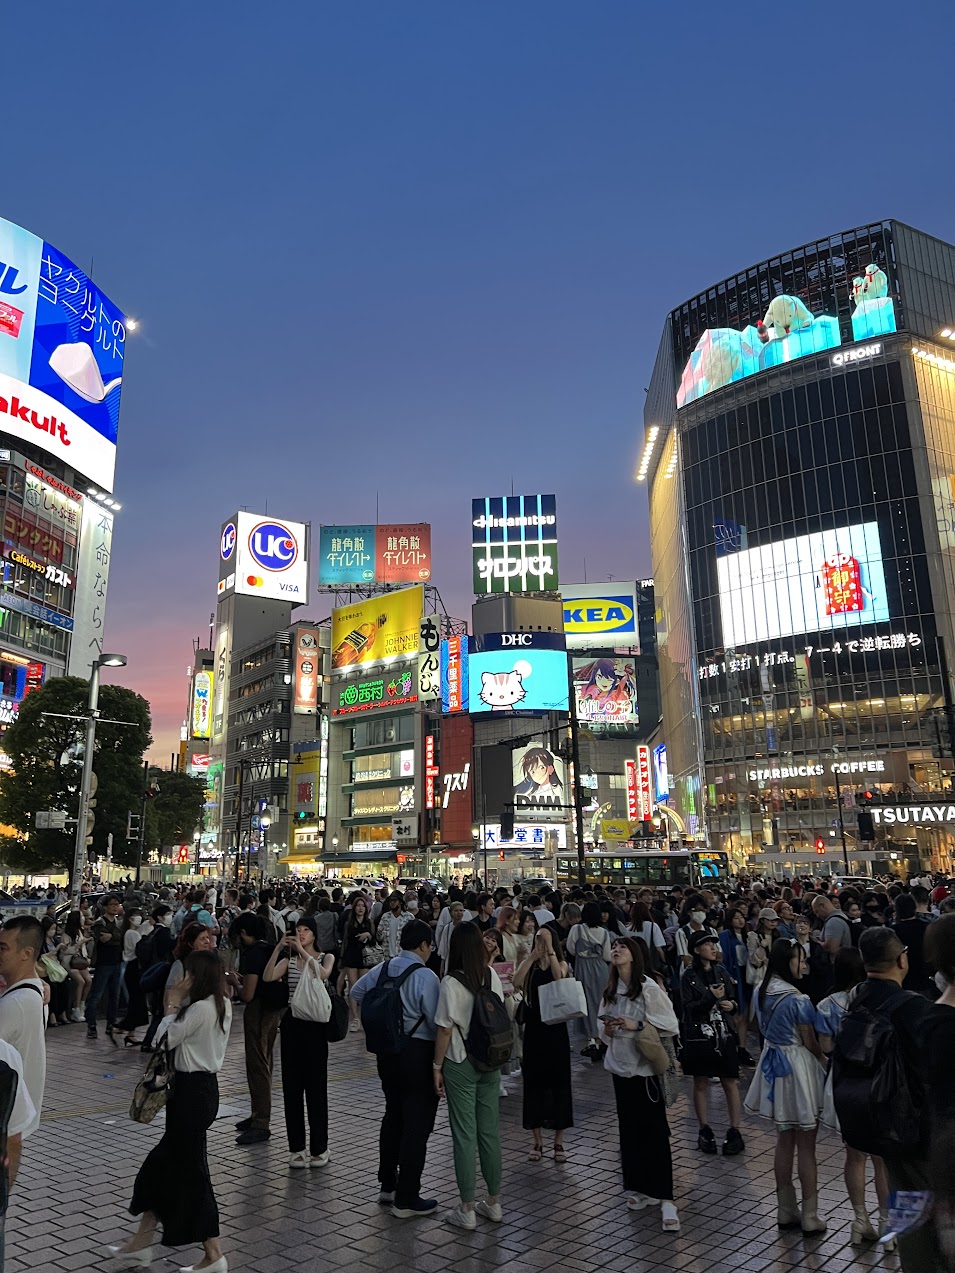
Summer trip to Tokyo, Kyoto and Nara 🏯

Blog Image

The Last of Us

January 2023

I got the special opportunity to make an appearance in The Last of Us 🎬

Experience πŸ“„

KPMG

Staff Accountant / Consultant, Fall 2023 - Winter 2025

  • Conducted thorough audits of financial statements, ensuring accuracy and compliance with GAAP and IFRS and PCAOB/SEC standards for both public and private clients ranging from $100M–$300M
  • Automated Excel files using Power Query to clean large datasets by removing null values, duplicates, and blanks
  • Assessed the integrity of a client’s software access internal controls by reviewing access policies, testing segregation of duties, and evaluating financial reporting risks and material impact that could arise
  • Used Power BI to visualize QoQ oil, gas, and NGL price variations from Sproule price decks (WTI, HH, etc.) to realized prices, delivering financial insights for publicly traded energy firms
  • Utilized SQL Database querying to pull internal company information on oil and gas clients
  • Served as the key liaison between clients' CFOs, Controllers, and KPMG leadership, ensuring seamless communication.

TRS Staffing Solutions

Accounting Assistant, Fall 2022

  • Prepared Bank Reconciliations and Trial Balances for 3 bank accounts, handling transactions from Canada, the UK, Europe, and India, totaling over $1 million in monthly transactions
  • Rapidly trained a new Analyst, enabling independent task execution ahead of schedule and earning recognition for efficiency
  • Supervised and reviewed Analyst's work, providing support during high-volume periods to ensure timely processing

Payroll Analyst, Spring 2022

  • Entered and updated information for 30+ employees/contractors, calculating pay and benefits based on attendance, leave, and overtime
  • Created and streamlined onboarding profiles for new hires, with an average of over 20+ new hires per week
  • Executed accurate payroll filing and remittance to the Canada Revenue Agency for accounts exceeding $1 million, ensuring compliance and accuracy
  • Investigated and resolved payroll discrepancies in collaboration with recruiters, achieving a 10% reduction in payroll errors
  • Consistently met deadlines for weekly payroll with efficiency and precision
  • Utilized Excel proficiently, applying functions such as VLOOKUP, IF, SUM, INDEX to effectively process large datasets

FBC

Quality Assurance Technician (Internship), Winter 2021

  • Accurately examined and analyzed and verified 2000+ tax documents (T4, T4A, OAS, T4E, T5, etc.)
  • Surpassed performance goals by 30% of daily completion of client accounts
  • Maintained regular communication with 15+ clients per week to ensure accurate recording of information
  • Organized inputted, and updated client data for over 300+ clients using FBC's proprietary software

Subway

Manager, 6 Years

  • Received recognition on a new monthly record of 30+ high reviews during my shifts (NPS)
  • Have solved frustrations on multiple accounts regarding customer complaints and chargebacks
  • Calling and emailing customers based on feedback with professional integrity
  • Working with Sysco, Uber Eats, DoorDash, and Skip the Dishes to maintain proper logistics and inventory
  • Reduced costs by making sure inventory levels are correct and match up with daily consumption
  • Reconciling receipts and cash through POS system
  • Prioritizing the safety of customers and staff during the pandemic with a high level of problem-solving (Created signage while imposing strict safety protocols)

Projects βš™οΈ

Transforming and Analyzing E-commerce Data

SQL (PostgreSQL) & Excel

  • Goal: Uncover valuable patterns and insights
  • Loaded CSV files into PostgreSQL, cleaned data, and used SQL queries
  • Thorough quality assurance process to ensure query accuracy
  • Results: Revealed top revenue-generating countries, best-selling products, and customer behavior patterns
  • Rewarding experience, honing SQL skills and gaining specialized insights into ecommerce industry
  • Check it out here

Statistical Modelling and APIs for Paris Bikestations

Python, Pandas, NumPy, Matplotlib, Seaborn

  • Used and merged City Bikes, Foursquare and Yelp APIs
  • The model explores the relationship between various independent variables, such as latitude, longitude, distance, review_count, and rating, and the dependent variable 'free_bikes,' indicating bike availability
  • Check it out here

Distribution of Tuberculosis

Tableau & Excel

  • Identified important features of the tuberculosis dataset, including country/territory, region, year, case detection rate, and mortality of TB cases
  • Discovered interesting patterns, trends, and outliers in the data, such as the concentration of TB mortalities in Africa and the correlation between detection and mortality rates
  • Check it out here

Clustering

Python, Pandas, NumPy, Matplotlib, Seaborn

  • Two customer segmentations are created using clustering techniques. The first segmentation is based on demographics and the second segmentation focuses on banking behavior
  • Factors such as savings account usage, amount saved, credit account usage, debt levels, and transaction patterns are used
  • Created radar and PCA charts
  • Check it out here

Predicting Flight Delays

Python, SQL, Pandas, NumPy, Matplotlib, Seaborn, Sklearn, XGBoost

  • Using machine learning to predict flight delays
  • June, July & August have the highest average departure and arrival delays
  • Check it out here

Loan Predictions & Deployment

Python, SQL, Pandas, NumPy, Matplotlib, Seaborn, Sklearn, AWS

  • Predicting whether a loan will be approved or rejected based on a set of input features such as gender, marital status, credit history, etc.
  • The baseline logistic regression model has an accuracy score of 0.78 meaning the model was able to predict 78% of the loan applications
  • Check it out here

Natural Language Processing

Python, SQL, Pandas, NumPy, Matplotlib, Seaborn, Sklearn, TF-IDF

  • project aims to build a machine learning model that can predict if two given questions are duplicates or not
  • The logistics regression model best fits sentiment analysis tasks that involve binary classification
  • Model scored 0.80 meaning the model was able to predict 80% of the questions with a precision score of 74%
  • Check it out here

Demand Prediction Using Time Series Analysis

Python, SQL, Pandas, NumPy, Matplotlib, Seaborn, Sklearn, TF-IDF

  • The project aims to predict the sales revenue for different products across various EU countries using historical sales data
  • Sales revenue is projected to increase by over 50.04%
  • Check it out here

Contact Me